Generic S3 plot() and autoplot() (ggplot2) methods to
visualize mlr3 spatiotemporal resampling objects.
Usage
# S3 method for class 'ResamplingSpCVDisc'
autoplot(
  object,
  task,
  fold_id = NULL,
  plot_as_grid = TRUE,
  train_color = "#0072B5",
  test_color = "#E18727",
  repeats_id = NULL,
  show_omitted = FALSE,
  sample_fold_n = NULL,
  ...
)

# S3 method for class 'ResamplingRepeatedSpCVDisc'
autoplot(
  object,
  task,
  fold_id = NULL,
  repeats_id = 1,
  plot_as_grid = TRUE,
  train_color = "#0072B5",
  test_color = "#E18727",
  show_omitted = FALSE,
  sample_fold_n = NULL,
  ...
)

# S3 method for class 'ResamplingSpCVDisc'
plot(x, ...)

# S3 method for class 'ResamplingRepeatedSpCVDisc'
plot(x, ...)
Arguments
- object
[Resampling]
mlr3 spatial resampling object of class ResamplingSpCVBlock or ResamplingRepeatedSpCVBlock.- task
[TaskClassifST]/[TaskRegrST]
mlr3 task object.- fold_id
[numeric]
Fold IDs to plot.- plot_as_grid
[logical(1)]
Should a gridded plot using via patchwork be created? IfFALSEa list with of ggplot2 objects is returned. Only applies if a numeric vector is passed to argumentfold_id.- train_color
[character(1)]
The color to use for the training set observations.- test_color
[character(1)]
The color to use for the test set observations.- repeats_id
[numeric]
Repetition ID to plot.- show_omitted
[logical]
Whether to show points not used in train or test set for the current fold.- sample_fold_n
[integer]
Number of points in a random sample stratified over partitions. This argument aims to keep file sizes of resulting plots reasonable and reduce overplotting in dense datasets.- ...
Passed to
geom_sf(). Helpful for adjusting point sizes and shapes.- x
[Resampling]
mlr3 spatial resampling object. One of class ResamplingSpCVBuffer, ResamplingSpCVBlock, ResamplingSpCVCoords, ResamplingSpCVEnv.
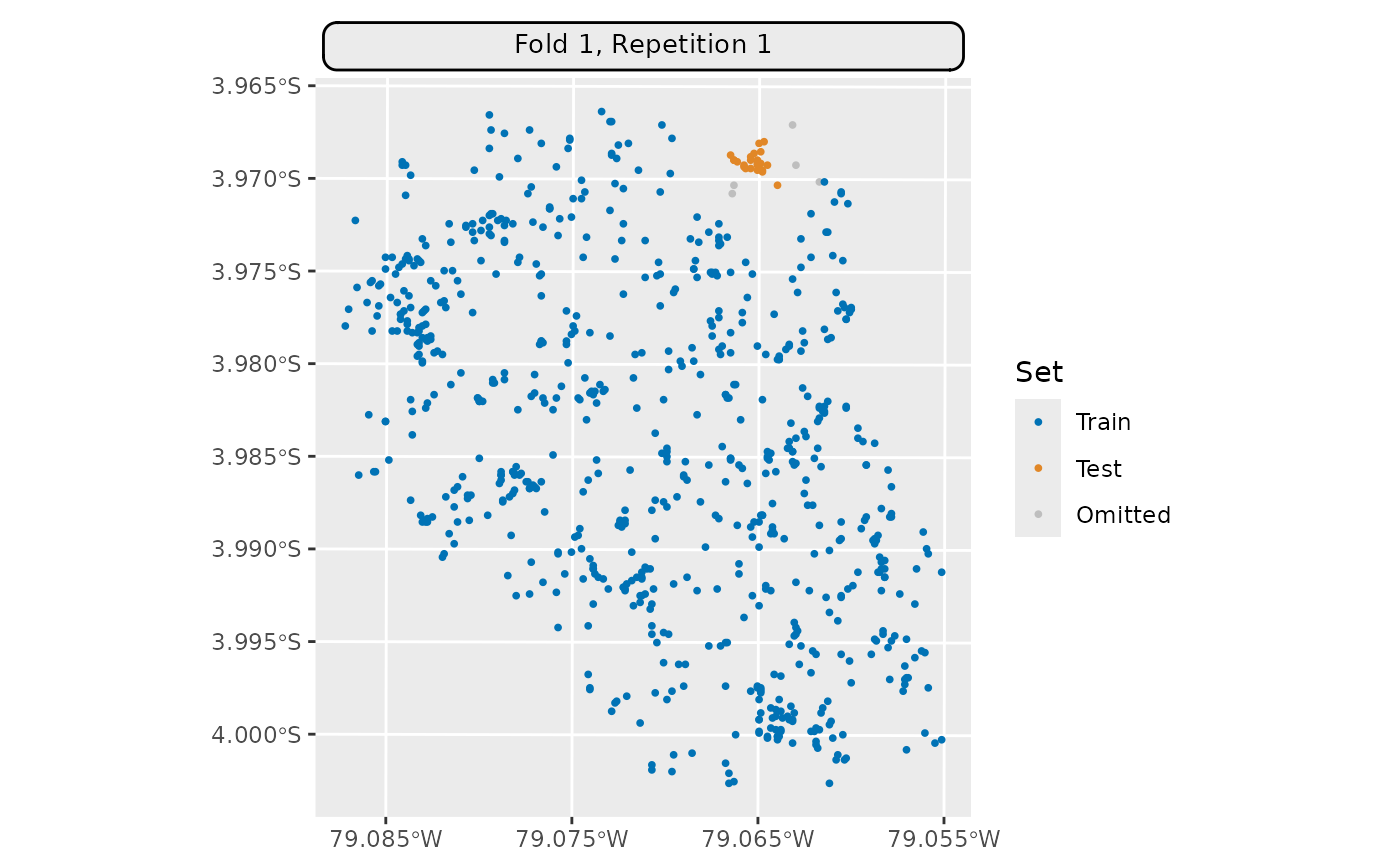
Details
This method requires to set argument fold_id and no plot containing all
partitions can be created. This is because the method does not make use of
all observations but only a subset of them (many observations are left out).
Hence, train and test sets of one fold are not re-used in other folds as in
other methods and plotting these without a train/test indicator would not
make sense.
2D vs 3D plotting
This method has both a 2D and a 3D plotting method.
The 2D method returns a ggplot with x and y axes representing the spatial
coordinates.
The 3D method uses plotly to create an interactive 3D plot.
Set plot3D = TRUE to use the 3D method.
Note that spatiotemporal datasets usually suffer from overplotting in 2D mode.
Examples
# \donttest{
if (mlr3misc::require_namespaces("sf", quietly = TRUE)) {
  library(mlr3)
  library(mlr3spatiotempcv)
  task = tsk("ecuador")
  resampling = rsmp("spcv_disc",
    folds = 5, radius = 200L, buffer = 200L)
  resampling$instantiate(task)

  autoplot(resampling, task,
    fold_id = 1,
    show_omitted = TRUE, size = 0.7) *
    ggplot2::scale_x_continuous(breaks = seq(-79.085, -79.055, 0.01))
}

# }
# }