Visualization Functions for Non-Spatial CV Methods.
Source:R/autoplot.R
autoplot.ResamplingCustomCV.RdGeneric S3 plot() and autoplot() (ggplot2) methods.
Arguments
- object
[Resampling]
mlr3 spatial resampling object of class mlr3::ResamplingCustomCV.- task
[TaskClassifST]/[TaskRegrST]
mlr3 task object.- fold_id
[numeric]
Fold IDs to plot.- plot_as_grid
[logical(1)]
Should a gridded plot using via patchwork be created? IfFALSEa list with of ggplot2 objects is returned. Only applies if a numeric vector is passed to argumentfold_id.- train_color
[character(1)]
The color to use for the training set observations.- test_color
[character(1)]
The color to use for the test set observations.- sample_fold_n
[integer]
Number of points in a random sample stratified over partitions. This argument aims to keep file sizes of resulting plots reasonable and reduce overplotting in dense datasets.- ...
Passed to
geom_sf(). Helpful for adjusting point sizes and shapes.- x
[Resampling]
mlr3 spatial resampling object of class mlr3::ResamplingCustomCV.
Examples
if (mlr3misc::require_namespaces(c("sf", "patchwork"), quietly = TRUE)) {
library(mlr3)
library(mlr3spatiotempcv)
task = tsk("ecuador")
breaks = quantile(task$data()$dem, seq(0, 1, length = 6))
zclass = cut(task$data()$dem, breaks, include.lowest = TRUE)
resampling = rsmp("custom_cv")
resampling$instantiate(task, f = zclass)
autoplot(resampling, task) +
ggplot2::scale_x_continuous(breaks = seq(-79.085, -79.055, 0.01))
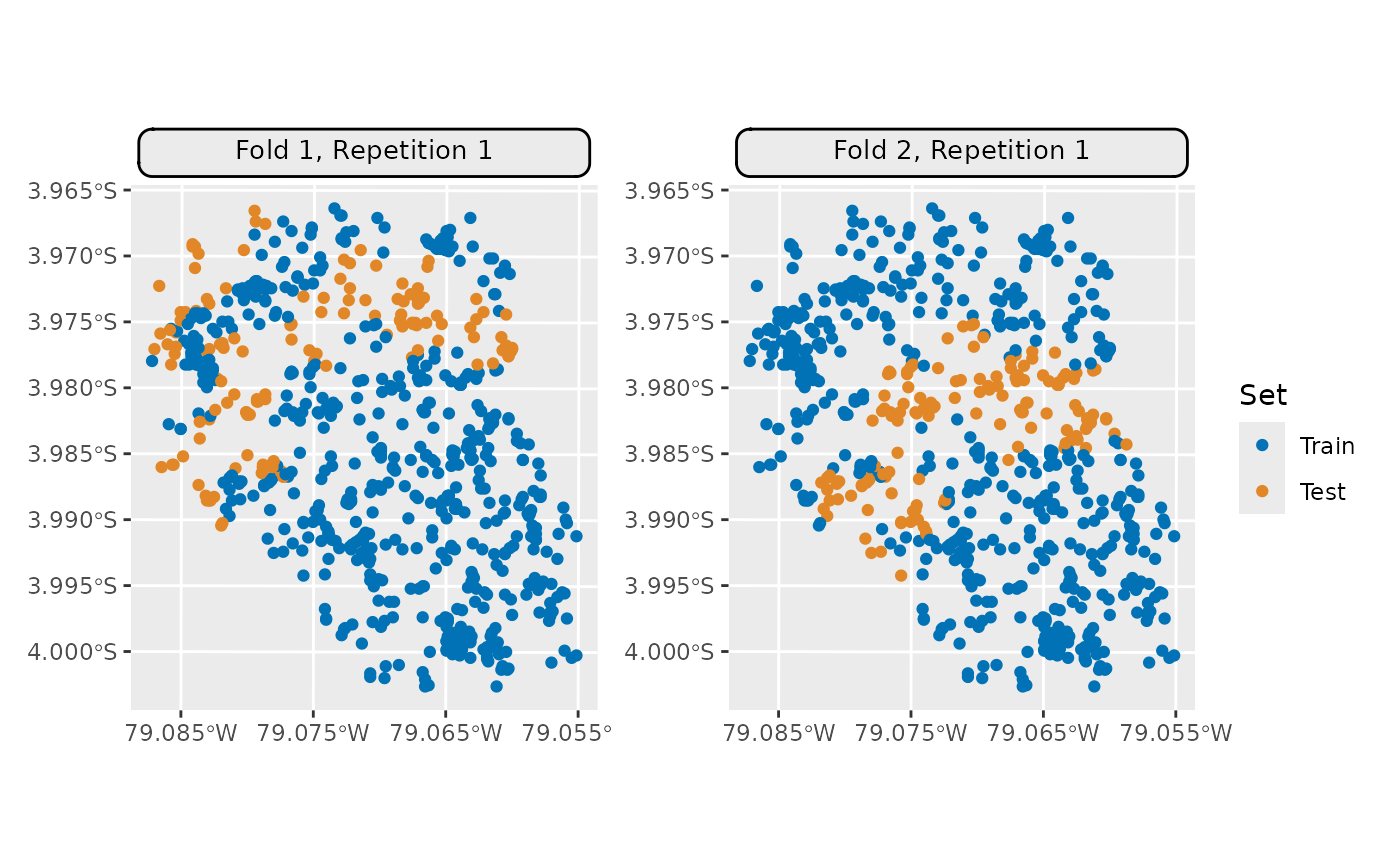
autoplot(resampling, task, fold_id = 1)
autoplot(resampling, task, fold_id = c(1, 2)) *
ggplot2::scale_x_continuous(breaks = seq(-79.085, -79.055, 0.01))
}