Generic S3 plot() and autoplot() (ggplot2) methods to
visualize mlr3 spatiotemporal resampling objects.
Usage
# S3 method for class 'ResamplingSpCVTiles'
autoplot(
  object,
  task,
  fold_id = NULL,
  plot_as_grid = TRUE,
  train_color = "#0072B5",
  test_color = "#E18727",
  repeats_id = NULL,
  show_omitted = FALSE,
  sample_fold_n = NULL,
  ...
)

# S3 method for class 'ResamplingRepeatedSpCVTiles'
autoplot(
  object,
  task,
  fold_id = NULL,
  repeats_id = 1,
  plot_as_grid = TRUE,
  train_color = "#0072B5",
  test_color = "#E18727",
  show_omitted = FALSE,
  sample_fold_n = NULL,
  ...
)

# S3 method for class 'ResamplingSpCVTiles'
plot(x, ...)

# S3 method for class 'ResamplingRepeatedSpCVTiles'
plot(x, ...)
Arguments
- object
[Resampling]
mlr3 spatial resampling object of class ResamplingSpCVBlock or ResamplingRepeatedSpCVBlock.- task
[TaskClassifST]/[TaskRegrST]
mlr3 task object.- fold_id
[numeric]
Fold IDs to plot.- plot_as_grid
[logical(1)]
Should a gridded plot using via patchwork be created? IfFALSEa list with of ggplot2 objects is returned. Only applies if a numeric vector is passed to argumentfold_id.- train_color
[character(1)]
The color to use for the training set observations.- test_color
[character(1)]
The color to use for the test set observations.- repeats_id
[numeric]
Repetition ID to plot.- show_omitted
[logical]
Whether to show points not used in train or test set for the current fold.- sample_fold_n
[integer]
Number of points in a random sample stratified over partitions. This argument aims to keep file sizes of resulting plots reasonable and reduce overplotting in dense datasets.- ...
Passed to
geom_sf(). Helpful for adjusting point sizes and shapes.- x
[Resampling]
mlr3 spatial resampling object. One of class ResamplingSpCVBuffer, ResamplingSpCVBlock, ResamplingSpCVCoords, ResamplingSpCVEnv.
Details
Specific combinations of arguments of "spcv_tiles" remove some
observations, hence show_omitted has an effect in some cases.
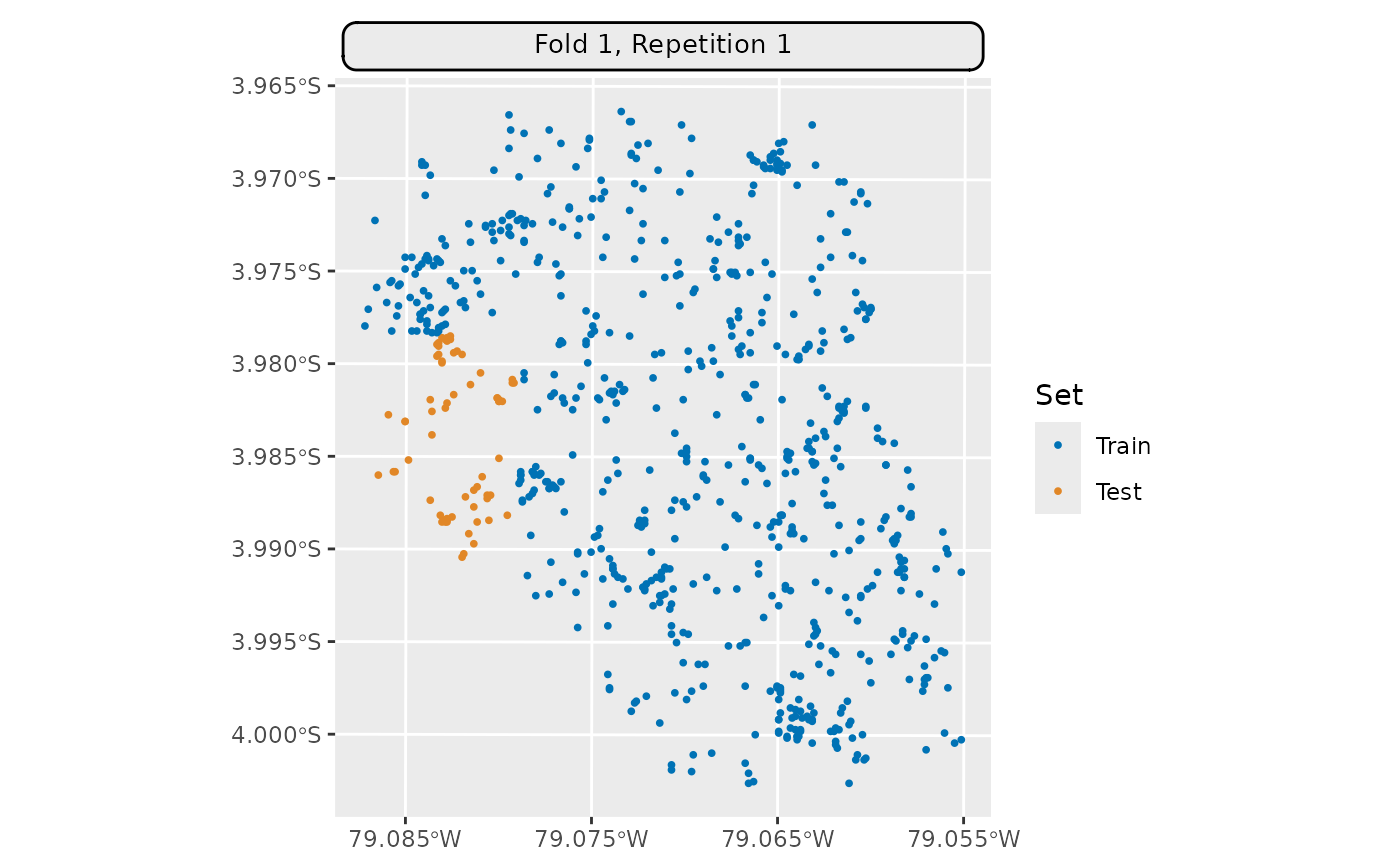
Examples
# \donttest{
if (mlr3misc::require_namespaces(c("sf", "sperrorest"), quietly = TRUE)) {
  library(mlr3)
  library(mlr3spatiotempcv)
  task = tsk("ecuador")
  resampling = rsmp("spcv_tiles",
    nsplit = c(4L, 3L), reassign = FALSE)
  resampling$instantiate(task)

  autoplot(resampling, task,
    fold_id = 1,
    show_omitted = TRUE, size = 0.7) *
    ggplot2::scale_x_continuous(breaks = seq(-79.085, -79.055, 0.01))
}

# }
# }